All standards
Reading: Informational Text4th Grade
RI.4.7
Interpret information presented visually, orally, or quantitatively and explain how it contributes to understanding.
For parents
Practice reading charts, graphs, and timelines — ask your child what story the data tells.Free sample questions
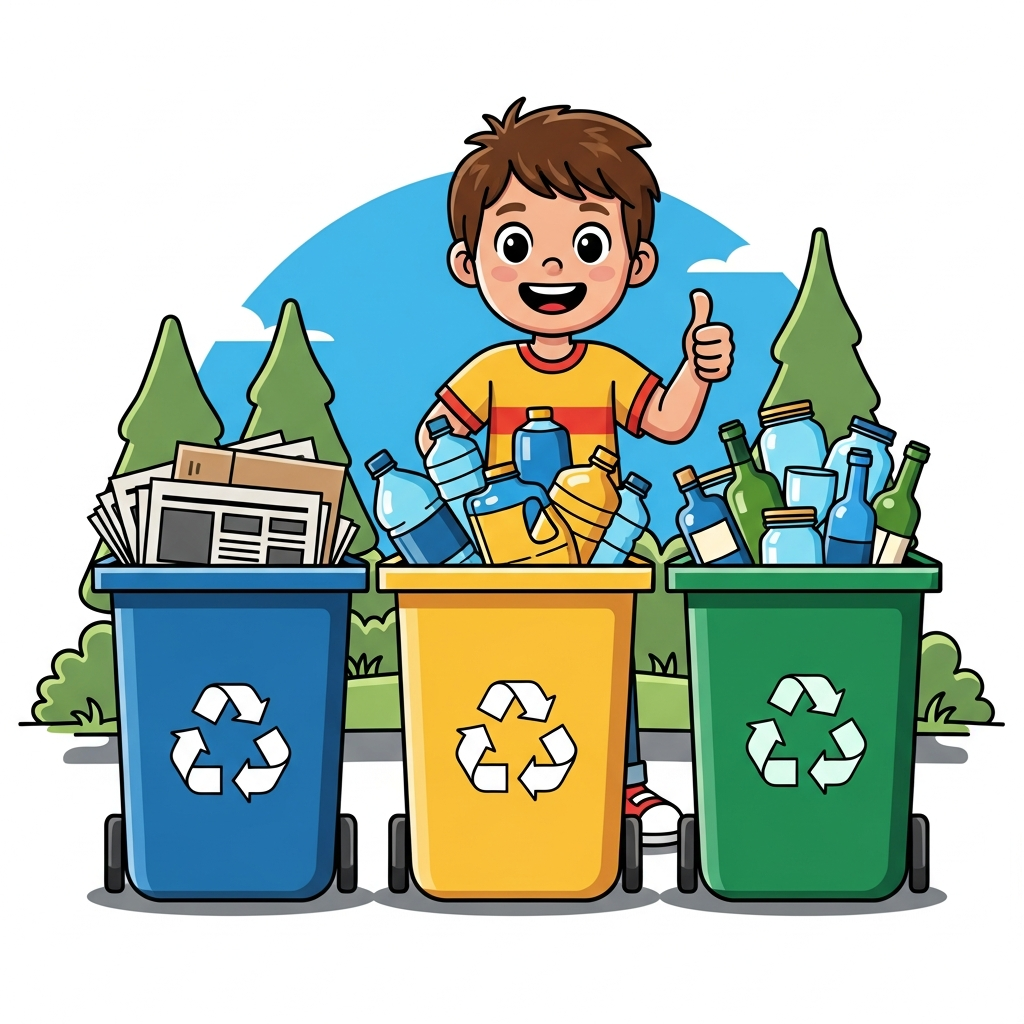 Question 1A bar graph shows that the school recycled 200 pounds in January, 350 in February, and 500 in March. What trend does the graph show?
- The school stopped recycling
- Recycling increased each month
- Recycling decreased each month
- Recycling stayed the same
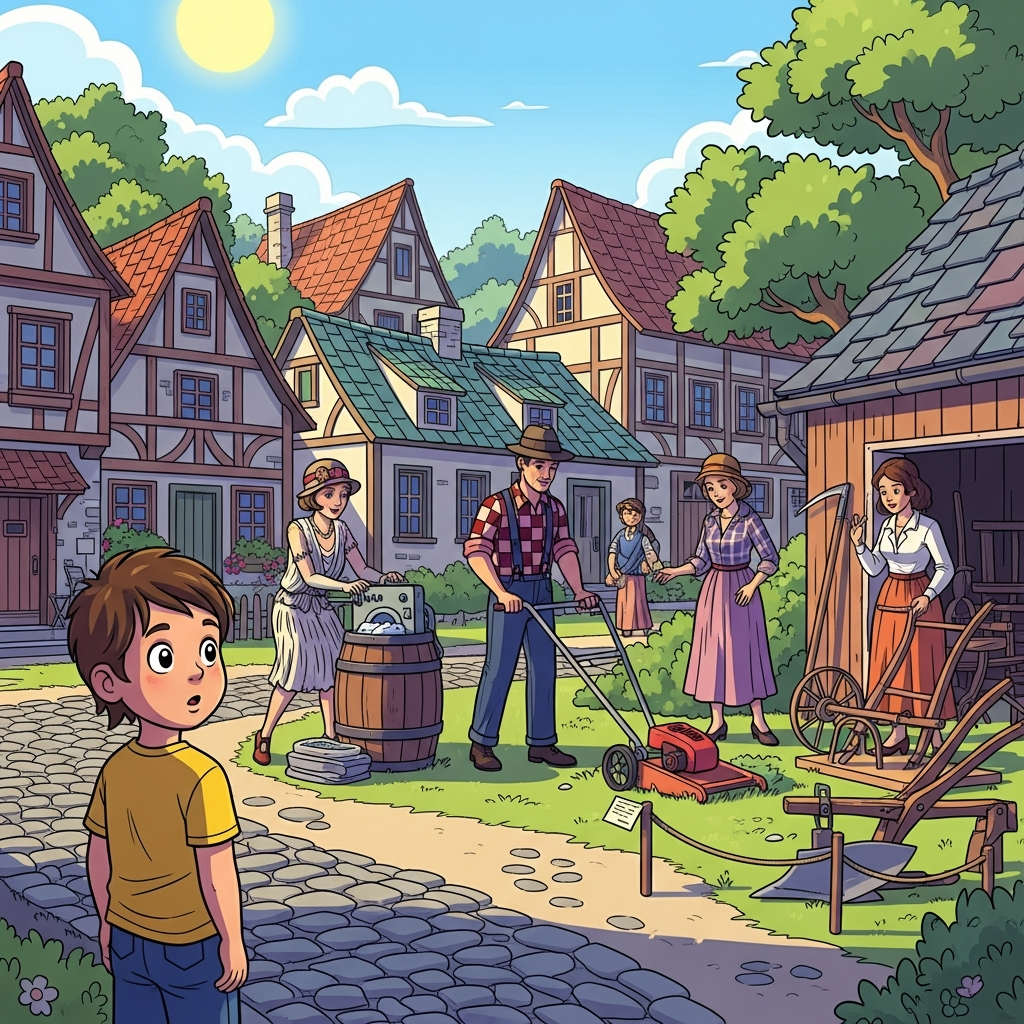 Question 2A timeline in a history text shows events from 1760 to 1790. This visual helps readers —
- Learn about geography
- Understand the exact words people said
- See the sequence and spacing of events over time
- Read faster
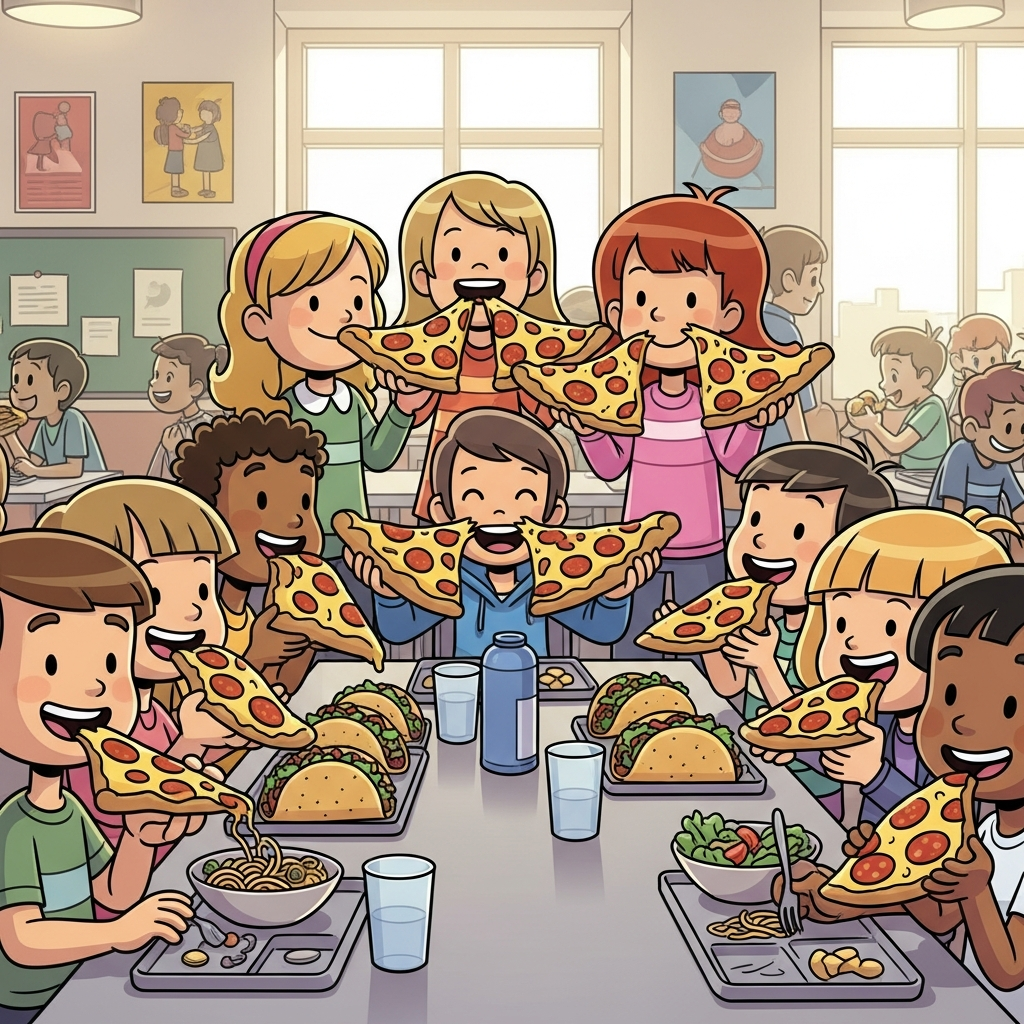 Question 3A pie chart shows: 45% of students prefer pizza, 30% prefer tacos, 15% prefer pasta, 10% prefer salad. What can you conclude?
- Salad is the most popular
- Tacos and pizza are equally popular
- Everyone likes pizza
- Pizza is the most popular but not everyone's favorite
Unlock 7 more questions for RI.4.7
Readee covers all 911+ K-4 reading comprehension questions aligned to Common Core ELA, with audio read-alouds, comprehension hints, and Science-of-Reading lesson walkthroughs.